Using the Test Prism Dashboard
The Test Prism UI provides an interactive dashboard to explore and analyze test execution results. It helps you quickly identify failures, understand trends, and gain insights into your testing cycles.
This guide explains how to interpret and use the features of the dashboard.
Layout Definition
The layout of the dashboard is configured using a Layout object. For more information on the Layout Definition, see the Layout Definition documentation.
Main Report View
The main report view is the primary interface for visualizing your test data. It is composed of configurable widgets that provide different perspectives on your test results.
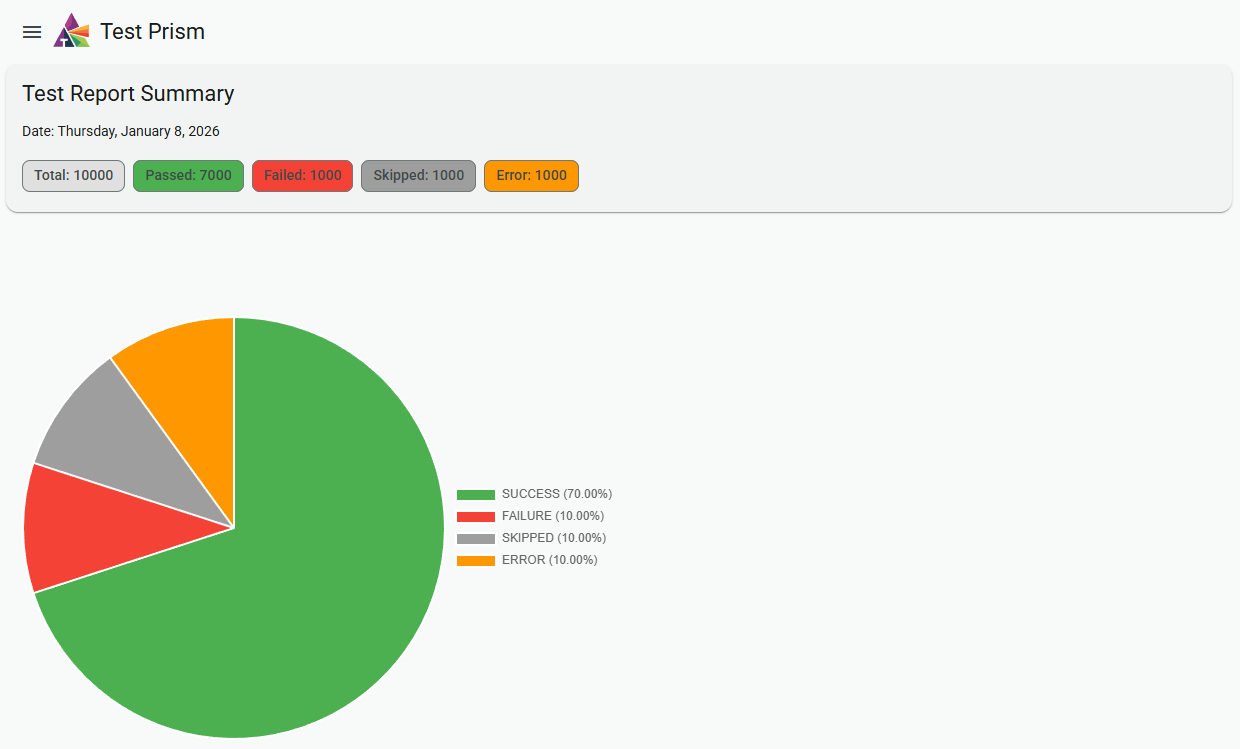
Common widgets include:
- Summary Widget: Provides high-level statistics such as the total number of tests, execution duration, and a breakdown of pass/fail/skipped counts.
- Distribution Pie Chart: Offers a visual representation of test results, showing the proportion of passed, failed, and skipped tests.
- Test Tree: A hierarchical navigation tool that mirrors your project's test structure, allowing you to drill down into specific suites and tests.
You can see all the available widgets and how to configure them in the All Available Widgets Documentation.
Navigating Test Results
The Test Tree widget organizes your test results in a hierarchical structure that mirrors your project's test suites and files.
- Expand & Collapse: Click on any suite or folder to expand it and see the tests inside.
- Status Indicators: Each test and suite is marked with an icon indicating its status (✅ Passed, ❌ Failed, ⏩ Skipped), allowing you to spot problem areas at a glance.
Analyzing a Specific Test
Clicking on a specific test in the Test Tree will bring up the Test Details view. This is where you can perform a deep dive into a single test's execution.
Information available in this view includes:
- Full Test Name & Path: The complete identifier for the test.
- Execution Status & Duration: The final result and how long it took to run.
- Error Logs: For failed tests, this section will display the complete error message, stack trace, or failure output, which is critical for debugging.